


Business Momentum for banks
See whether recent business results and expert expectations are improving or weakening. We use checks suited to lending. A bank’s money set aside to absorb losses is called its capital buffer. Is income growing for each share? Is the business earning more profit for each share? 12.5%: Is lending income after interest costs improving relative to income-earning assets? 12.5%: Is profit on owners’ money improving? Are there fewer or more shares? Fewer shares earn more points here. Have experts raised or lowered their forecasts for future profit? Was the latest profit above or below the experts’ forecast? The score runs from 0 to 100. 60–100 means improving, 40–59 means mixed, and 0–39 means weakening. This describes changes in the business. We compare reports with the same periods a year earlier. The newest comparison counts 70%; the preceding one counts 30%. If only one is available, we use it and show that less information supports the score. The ordinary cash check does not apply here. The other parts share the score; the percentages above already allow for that. Missing figures reduce the information supporting the score and may change how much each remaining check counts. With too little usable information, no score is shown. Read the notes beside the company’s score. A strong business can still have an expensive share price. The score does not predict what the share price will do. We compare each recent report with the corresponding period of the previous financial year. For example, a company's first half is compared with its first half a year earlier. This helps avoid confusing seasonal changes with progress. The newest comparison counts 70%. The comparison for the preceding reporting period counts 30%. Recent results therefore matter most, while the preceding report still contributes. If only one comparison is available, we use it and show that less information supports the score. We do not replace a missing recent report with an older one. If only annual reporting can be used, we compare the latest full year with the year before, and that year with the preceding year. We do not use rolling 12-month totals. An unchanged result normally gives 50 points. Improvement gives more points and deterioration fewer, on a scale from 0 to 100. Between the values below, the points change gradually. Changes in margins and returns are measured in percentage points. For example, a margin rising from 10% to 12% has improved by 2 percentage points. That is different from a 2% rise in sales. For earnings and cash amounts, a smaller loss counts as improvement. Moving from a loss to a profit gives 100 points, and moving from profit to loss gives 0. Starting from zero, a positive result gives 100, a negative result 0, and another zero 50. For other changes, we divide the difference by the size of the earlier amount, ignoring its minus sign. We set aside impossible inputs, such as negative sales or a share count of zero. They do not earn points. We follow the forecast for the first financial year after the latest completed year. We compare the latest forecast with one recorded 90 to 120 days earlier. The latest forecast must be no more than 45 days old and come from at least one analyst. We normally use profit per share adjusted for unusual items, called normalized EPS. If it is unavailable, we use the unadjusted EPS forecast for the same year. We use one of these measures, not an average of both. For REITs, we use FFO per share. A forecast based on few analysts has less influence. With one analyst, a result that would otherwise give 100 points becomes 60. With five or more analysts, it keeps all 100. The same adjustment pulls low scores towards 50. The calculation is: 50 + (points before adjustment − 50) × the smaller of analyst count ÷ 5 and 1. For results versus expectations, we compare reported profit with the analysts' average forecast for that exact reporting period. We use normalized EPS, or FFO for REITs. If the latest reporting period cannot be compared, we try the latest full financial year. An estimate never replaces a missing reported result. A part can contribute to the score when at least one of its two report comparisons is available. Both comparisons provide full coverage; the newest alone provides 70%, and the earlier alone 30%. Coverage means how much of the planned calculation we can support with data, taking each part's share into account. High confidence requires at least 90% coverage, Medium at least 70%, and Low at least 60%. Below 60%, we do not show a score. Parts that do not apply to the company type are left out of this calculation too. For banks, using net interest income divided by assets in place of the reported net interest margin limits confidence to Low. Other permitted alternatives do not automatically lower this label further. Notes explain missing information and substitutions. Business Momentum does not add separate warning badges.The score in pictures
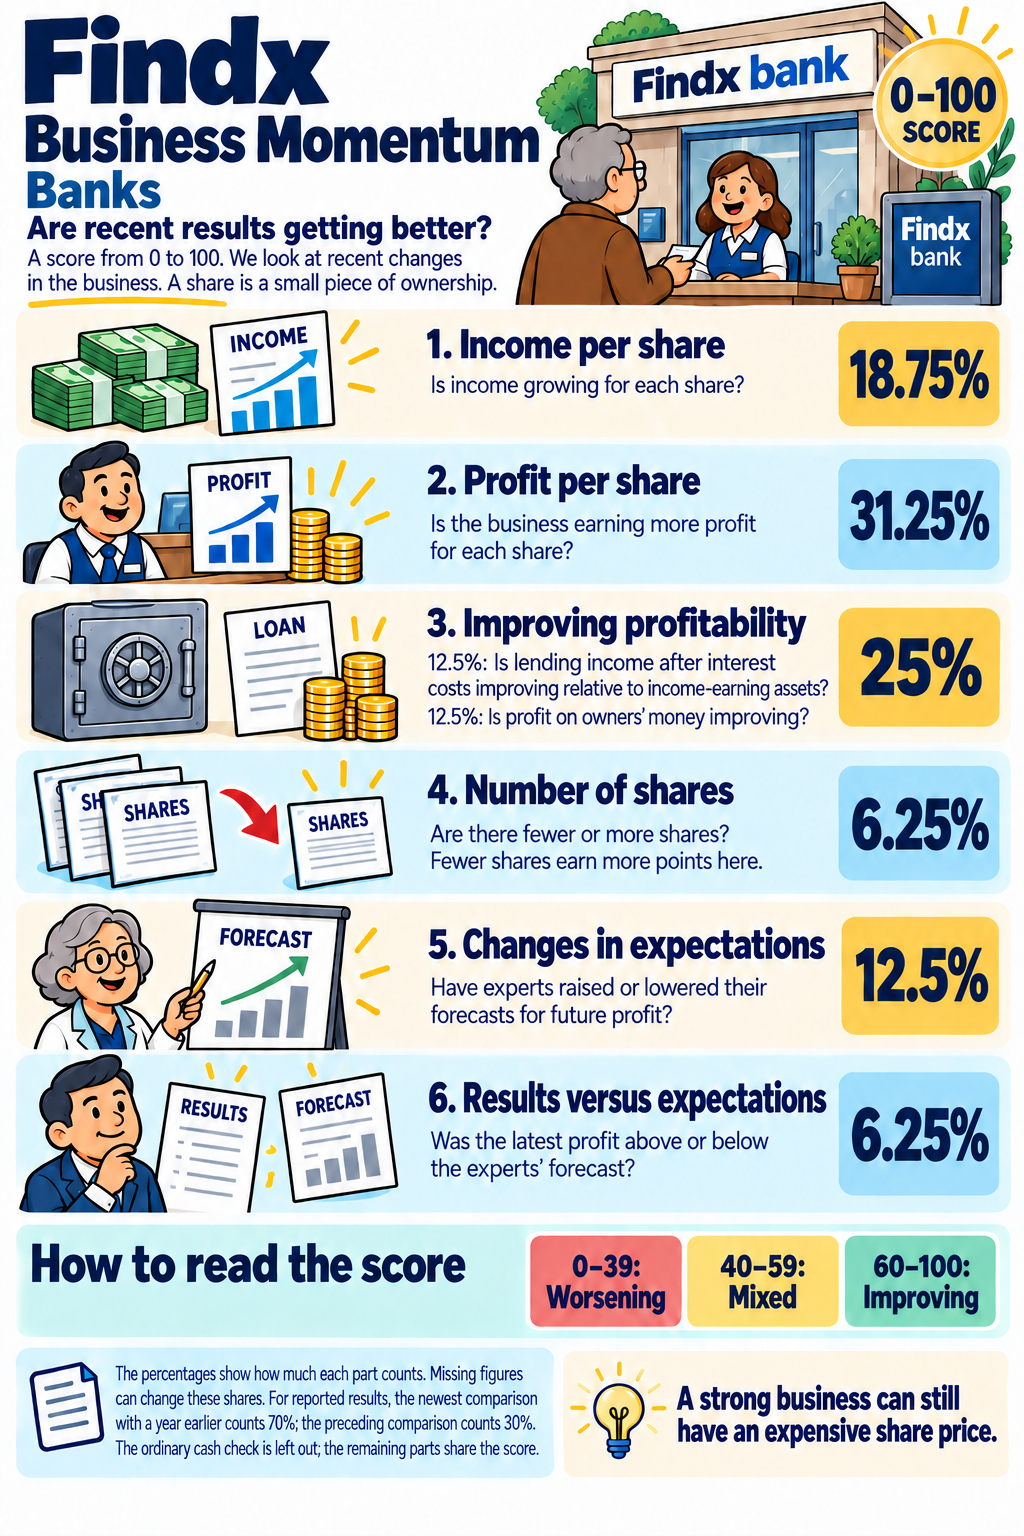
What we check
Income per share (18.75%)
Profit per share (31.25%)
Improving profitability (25%)
Number of shares (6.25%)
Changes in expectations (12.5%)
Results versus expectations (6.25%)
How to read the score
How we calculate the points
Which reports do we compare?
How changes become points
How we use analyst expectations
How much information supports the score?