


How Findx calculates fair value
Growing earnings can justify paying more for a share. Findx uses four growth groups to choose how much to pay for each unit of earnings.
Earnings per share (EPS) is the company’s annual profit divided by its number of shares. P/E means share price divided by earnings per share. A chosen P/E of 15 values each unit of annual earnings at 15.
This formula is used when you select EPS growth in period, Estimated EPS growth (2y) or Estimated EPS growth (3y). It is not used to choose P/E under Analyst price target, P/E range (18m) or My values.
For a period spanning several years, Findx uses the equivalent steady yearly growth rate between the first and last earnings figures. For example, 2 growing to 2.42 over two years is 10% per year. The actual years can grow at different rates.
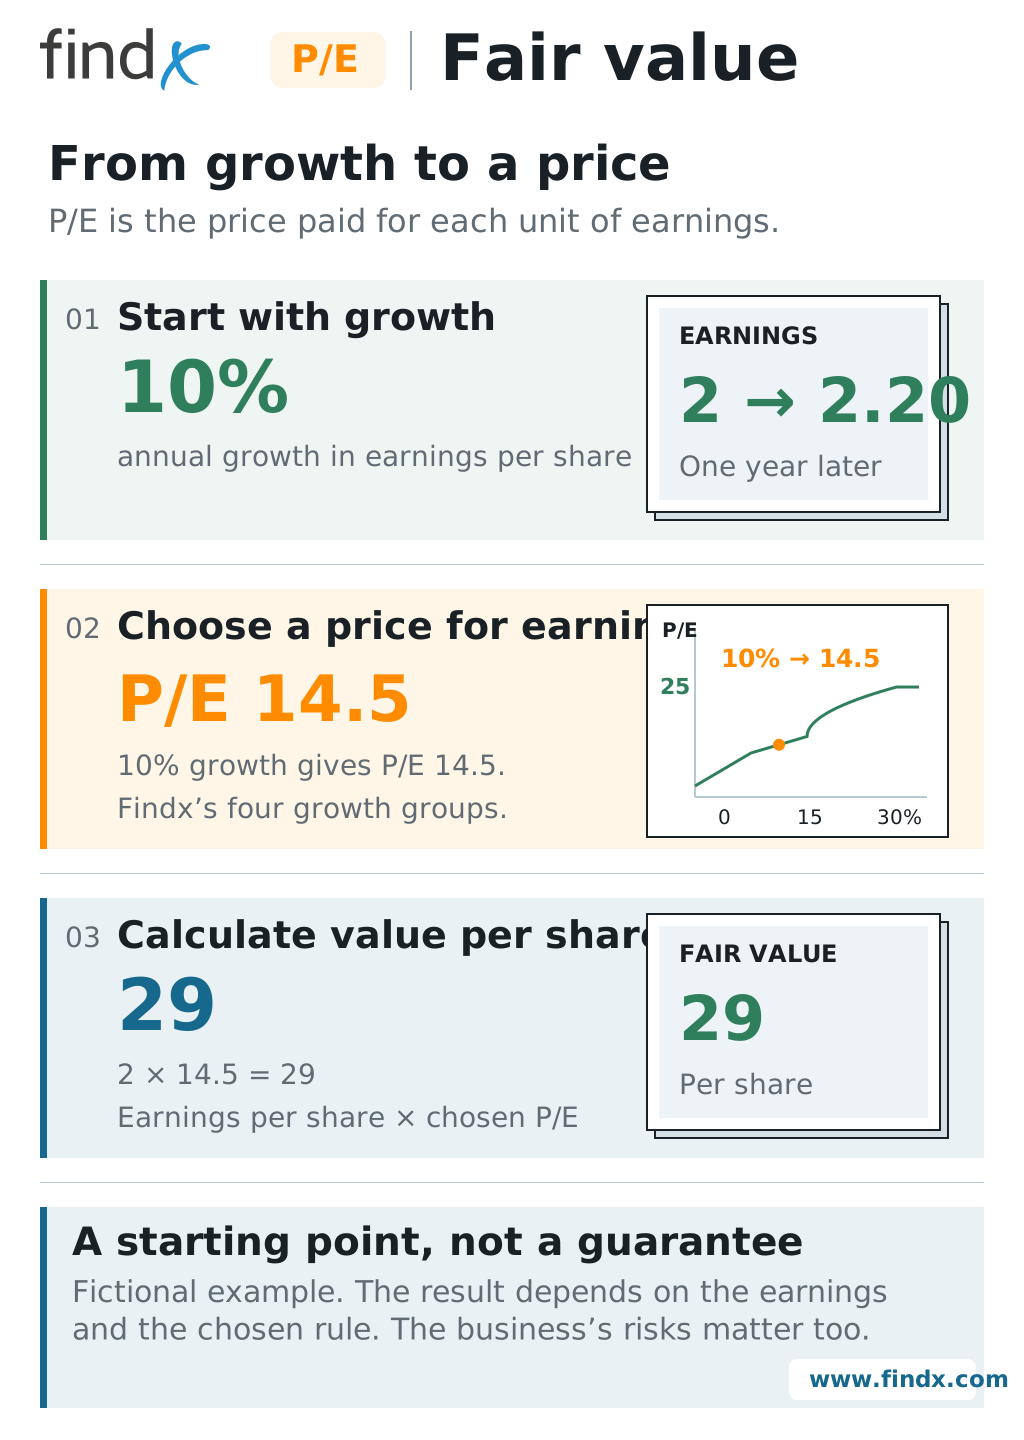
Follow the example
- Find annual earnings growth. Here it is 10%: each 1 of earnings grows to 1.10 in a year.
- Use the matching growth group. 10% sits in the moderate-growth group shown below. Its rule gives P/E 14.5.
- Multiply by the chart’s earnings figure. Earnings of 2 per share × P/E 14.5 give fair value 29 per share.
The growth rate selects the P/E. The earnings figure converts that P/E into a price. They have different jobs in the calculation.
The four growth groups
The growth rate measures the yearly change in earnings per share. These are four parts of one calculation, not four fixed price tags.
Each row uses the same P/E scale, from 7 to 25. The blue bar shows the group’s range. The short vertical mark shows the example. Further right means a higher price for the same earnings.
Shrinking
Below 0% growth · P/E 7 to below 10
Falling earnings get a lower price.
Example: −3% growth → P/E 8.2
Slow growth
0–5% growth · P/E 10–13
Even a business with no growth can have value.
Example: 3% growth → P/E 11.8
Moderate growth
Above 5%, up to 15% · P/E above 13, up to 16
More growth earns a modest extra price.
Example: 10% growth → P/E 14.5
Fast growth
Above 15% growth · P/E above 16, up to 25
Faster growth earns a higher price, with a limit.
Example: 20% growth → P/E ≈ 21.03
The exact calculation
- ▸ Growth < 0%: max(7, 10 + growth × 0.6)
- ▸ 0% to 5%: 10 + growth × 0.6
- ▸ Above 5% and up to 15%: 13 + (growth - 5) × 0.3
- ▸ Above 15%: min(25, 16 + √(growth - 15) × 2.25)
In the fast-growth rule above, the square root makes each additional percentage point of growth add less extra P/E than the previous one. The maximum of 25 limits the price the rule assigns to very fast growth. This describes the rule within the fast-growth group; the sensitivity at its starting point is explained below.
For the moderate-growth example, the calculation is 13 + (10 − 5) × 0.3 = 14.5.
Sensitivity, limits and missing growth
The parts join without a gap, but the calculation becomes more sensitive just above 15% growth: 15% gives P/E 16, while 16% gives 18.25. With the same earnings, that raises fair value by about 14%. A small forecast change can therefore matter.
The minimum of 7 is reached at a decline of 5% or more. It does not guarantee a struggling company is worth that much. The maximum of 25 is reached at 31% growth. It limits what this rule pays; an exceptional company may justify more.
If the selected period starts with zero or negative earnings, or ends with negative earnings, Findx uses a default P/E of 10 and shows a warning. That is a reference value, not a growth-based valuation. Missing earnings at either end give no growth-based fair value. Positive starting earnings that fall to zero count as a 100% decline.
The two- and three-year forecast choices require positive starting and ending earnings; otherwise that choice is unavailable. Property-company calculations use the same rule with the selected FFO or AFFO earnings measure. These property earnings measures are explained in the earnings guide.
Why relate P/E to earnings growth?
Findx’s four growth groups assign lower P/E to shrinking earnings and allow higher P/E for faster growth, up to a limit. Established investing ideas support considering price and growth together. The exact boundaries and formula are our choices. The exact limits and formulas are Findx’s choices. The sources support the principles, not proof that our numbers are best. A historical market average does not establish today’s fair value for a particular company. Peter Lynch: compare the price with growth. Lynch popularised comparing P/E with the expected long-term growth rate. This comparison is called PEG: P/E divided by growth. A P/E of 20 and annual growth of 20% give a PEG of 1. It is a useful question to ask, not a law that fixes fair value. Findx follows the idea of relating price to growth, but does not use a fixed PEG rule. Source: Fidelity-hosted presentation, Learn from investing legends for 2020 & Beyond, slide 4. Chan, Karceski and Lakonishok: do not assume rapid growth will last. Their study found that very high long-term growth was rare and difficult to predict. Analysts' long-term growth forecasts were also too optimistic in their sample. This supports caution about paying ever more for faster growth. It does not prove our chosen cap or formula, and it does not mean every short-term forecast is wrong. Source: The Level and Persistence of Growth Rates, NBER working paper (2001), published in The Journal of Finance (2003). Warren Buffett: growth must be worth its cost. Buffett explains that growth adds value only when the money needed to produce it earns enough in return. A company can grow while making its owners worse off. This is why we ask you to check the business behind the growth number. Buffett did not propose or endorse the Findx tiers. Source: Berkshire Hathaway's 1992 shareholder letter, discussion of growth and value. Aswath Damodaran: growth is only one part of a fair P/E. His valuation work also links P/E to risk, interest rates and how much profit can reach shareholders. Two companies growing at the same rate can deserve different prices. He also explains why a low PEG alone does not prove a bargain. These are limits we recognise, not factors secretly included in our growth formula. Source: Price Earnings Ratio and PEG Ratios, NYU Stern. Growth can disappoint, cost more to fund than it creates in value, or simply reflect a rebound after a bad year. Check debt, cash generation and several years of earnings. Our formula does not separately adjust for interest rates or how long growth will last. Applying the same groups to property earnings is also a Findx choice.Read the reasoning, research and limitations