


INTRODUCTION TO FINDX
Find quality businesses and compare their share prices with estimated fair value. Learn the Findx approach to researching a stock, step by step.
Read this first
The single most important idea in Findx: Fair Value is an estimate, and you choose how it is calculated. We give you a sensible default, but you should pick the valuation basis that fits your own belief rather than blindly trusting ours. Learn how →
Findx is an analysis tool that helps you assess whether a stock is cheap or expensive relative to its calculated fair value.
Most tools only show you price movements. Findx answers the more important question: What is the stock actually worth? This makes it easy to see whether the price is above or below fair value, instead of just seeing whether the stock has gone up or down.
▸
Price and fair value are shown in the same chart, both historically and forward-looking.
▸
Instantly see whether the market is overvaluing or undervaluing the company.
▸
You get a visual anchor for valuation, not just a price chart.
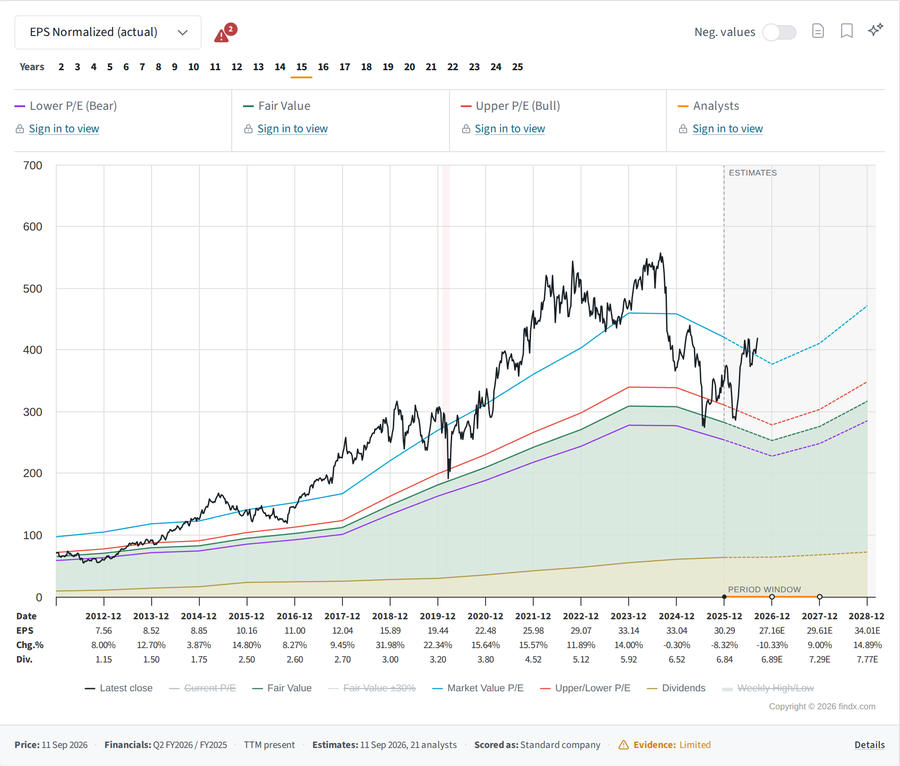
Why is the chart so effective?
The chart gives you a quick visual overview of whether the stock looks expensive or cheap, in both absolute and historical terms. At a glance you can see:
▸
Fair value from reported results: The value the model calculates from the company's reported earnings and the selected growth.
▸
Fair value based on forecasts: The same line continued with analysts' expected earnings for the coming years. It is a forecast, not the separate analyst price target.
▸
Historical market value: What the stock would cost at the P/E the market has historically paid for it, applied to earnings day by day.
▸
Share price: Weekly traded price in the period. Is it above or below fair value?
▸
Dividend: Dividends paid out. Are they covered by earnings?
▸
Measured return: Return between two dates you select yourself, in total and as a percentage per year.
▸
Price vs fair value: Select a point on the chart to see the percentage difference between the price and fair value or market value.
"Price is what you pay. Value is what you get."
- Warren Buffett
Read about how we calculate fair value.
Who publishes Findx?
Findx is published by Privacore ApS, Bakkekammen 44, DK-4300 Holbæk, Denmark. CVR: 36479604.
Data sources and calculations
The company figures, analysts' estimates and share prices on Findx come from S&P Global Market Intelligence, a large provider of financial data.
Findx does its own calculations on those figures to produce the fair value lines, ratios, scores and comparisons you see on each page. Those results are Findx's own; they are not recommendations from S&P or its analysts. The valuation is explained in How Findx calculates fair value and the scores in the Scores document.
Findx also uses AI-assisted text generation for company descriptions and filing summaries. These summaries can contain errors. Use the linked company reports and source documents to check details.
Share prices, company reports and analysts' estimates are from different dates. Each stock page shows the dates behind its figures. The date a page was built does not mean every figure was updated that day, and figures and estimates can be revised or incomplete.
Questions about the data? Contact hi@findx.com with the page link and the figure concerned.
Content updated 2026-09-13.