


Understand Market P/E
Market P/E shows what investors have paid for the company’s earnings in the selected period. It helps you compare today’s price with the company’s own history.
Compare prices relative to earnings
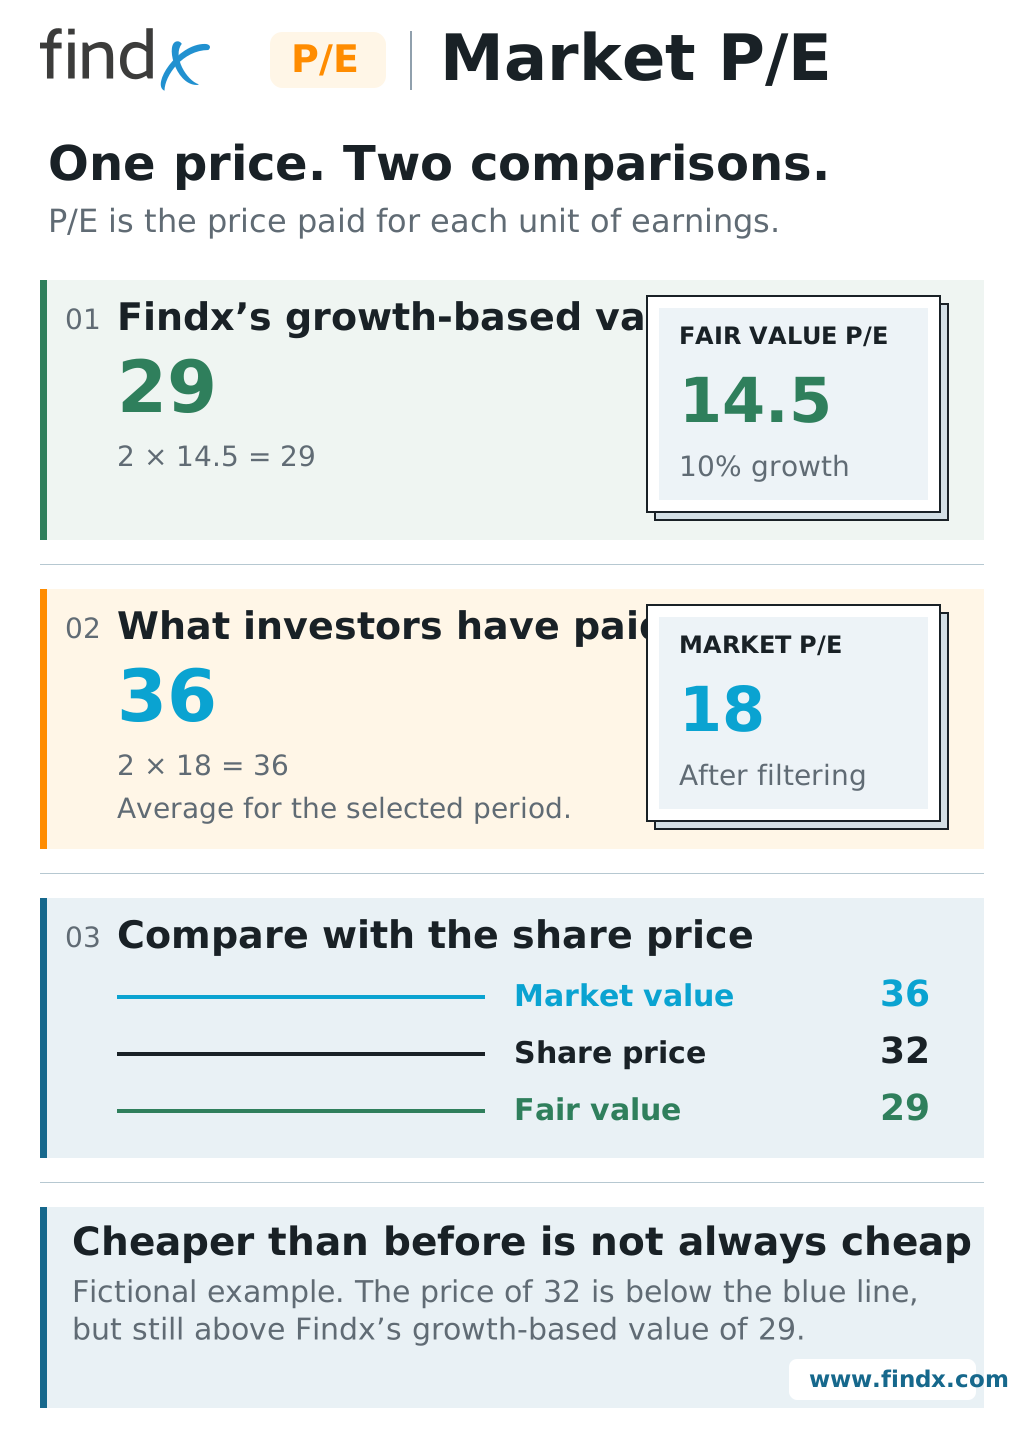
Earnings per share is the company’s annual profit divided by its number of shares. P/E means share price divided by earnings per share. A price of 36 and earnings of 2 give P/E 18.
Market P/E is Findx’s historical average of the company’s P/E, after filtering unusable and extreme values. It is about this company, not the average P/E of the whole stock market. The “selected period” is the time period chosen for the stock chart.
See the comparison on a chart
With invented numbers, Market P/E of 18 and earnings of 2 per share give a comparison price of 36. The screenshot below uses the real DOX.US figures instead. It is the same stock chart as in the overview, with the blue Market Value P/E line switched on.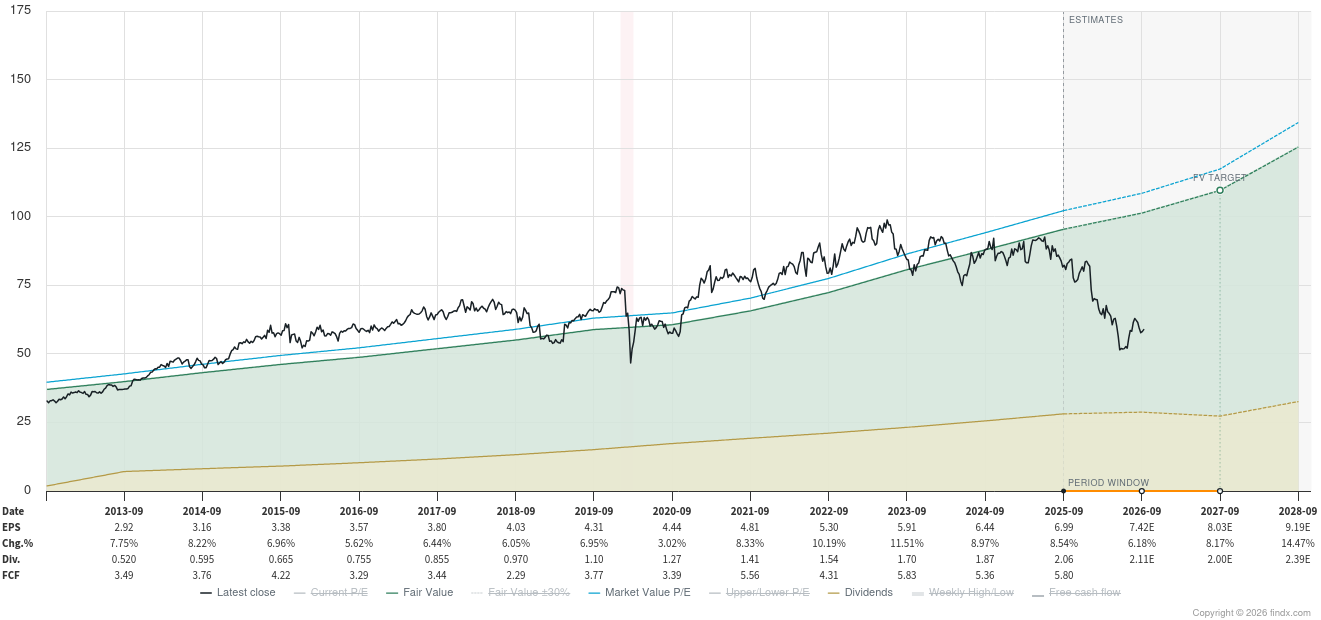
- Blue — value at Market P/E: earnings per share multiplied by the company’s historical average P/E for the selected period.
- Green — fair value: earnings per share multiplied by the P/E from your chosen valuation method.
- Black — share price: the price investors actually paid. Compare it with each line at the same date. Near the latest recorded price in this screenshot, it is below both.
The blue line changes with earnings even though the selected period supplies one Market P/E. A higher share price can therefore still be cheaper relative to earnings if earnings have risen faster. Findx calculates daily P/E using blended earnings for each date. “Blended” means an earnings figure that moves gradually between the company’s annual figures. It keeps dates with a recorded share price in the selected period. The earnings can include forecasts, so this is not a reconstruction of what investors knew on each historical date. Missing, zero and negative P/E values are removed. If the period contains zero or negative P/E, positive values above 150 are also removed. All occurrences of the highest and lowest remaining P/E are then removed. The rest are averaged. If nothing usable remains, Market P/E is unavailable.How the average is calculated
See the calculation as an infographic
How is this different from P/E range (18m)?
Market P/E uses a filtered average over the selected chart period and draws the blue comparison. P/E range (18m) uses the recent high and low to choose the green valuation line and the upper and lower bands. One compares with an average; the other compares with a range.
See the range and its price bands on a separate example chart.