


Understand P/E bands
P/E bands are the upper and lower price lines around the fair value line on a stock chart. They let you compare the share price with three different valuations. Your selected valuation basis determines how they are calculated.
First, distinguish P/E from price
Earnings per share is the company’s annual profit divided by the number of shares. P/E means share price divided by earnings per share. The P/E fields beside the stock chart show ratios; the chart lines show prices per share.
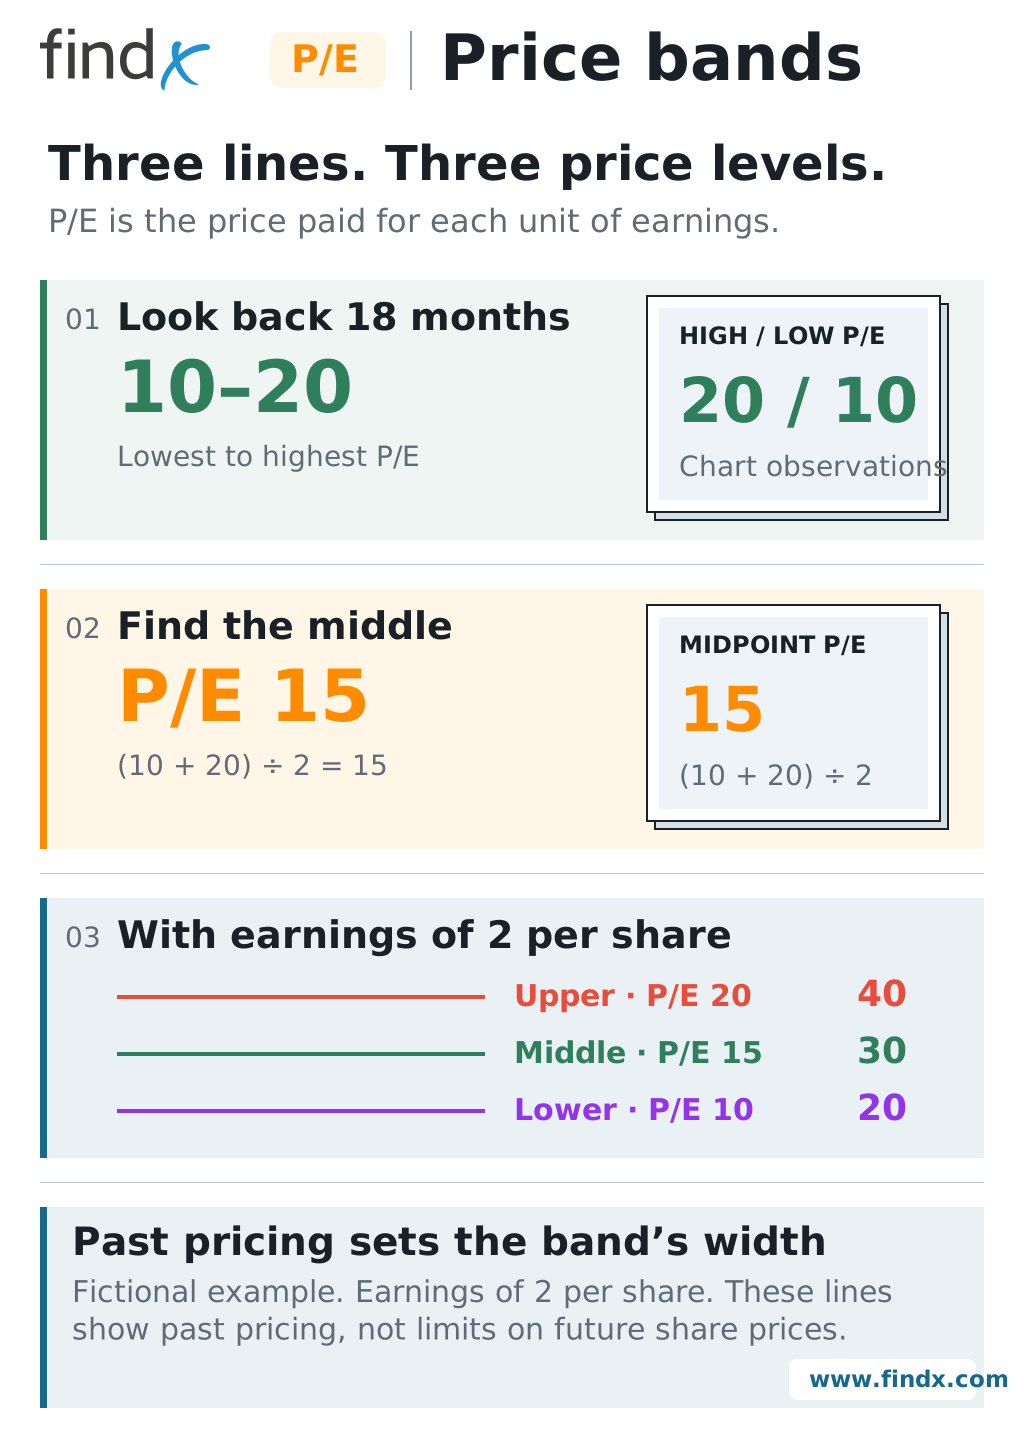
For example, P/E 20 and earnings of 2 per share give a price line at 40: 20 × 2. P/E 20 does not mean a share price of 20. Findx looks back 18 months from the latest available share-price date. It finds the highest and lowest usable P/E among the chart’s points. The high sets the upper P/E, the low sets the lower P/E, and their midpoint sets Fair Value P/E. Suppose the lowest P/E was 10 and the highest was 20. The middle is 15: (10 + 20) ÷ 2. This is halfway between the extremes, not an average of every observation. With earnings held at 2 per share, those choices produce the price lines below. The black line is the share price moving through the 18-month example. Price per share · same currency throughout The observed P/E range sets the width. There is no fixed 10% gap for this choice. The upper and lower lines describe the high and low of recent pricing relative to earnings; they are not limits on where the share price can go next. The middle is a historical comparison under this choice, not a result of the earnings-growth formula. Changing the chart’s earnings figure moves all three price lines, even if the P/E settings stay the same. The range uses the same points as the chart: one point per completed week, plus daily points for the current unfinished week. It does not use every daily or intraday high and low. Each P/E uses the blended earnings figure for that date, which moves between annual figures and may include analyst estimates. Missing, zero and negative P/E values are excluded. If no usable positive P/E remains, this choice is unavailable. The 18-month window ends at the latest available price date. Changing the displayed chart period does not move that window. Changing the earnings measure can change the range. Unlike Market P/E, this method keeps the highest and lowest usable values instead of removing them before taking an average.When you choose P/E range (18m)
Which observations are used?
See the range calculation as an infographic
What changes with the other valuation choices?
The three earnings-growth choices and Analyst price target first choose Fair Value P/E. Their upper and lower P/E start 10% above and below that number. For example, Fair Value P/E 15 gives upper P/E 16.5 and lower P/E 13.5. With earnings of 2, the three prices are 33, 30 and 27.
This fixed 10% spacing is a comparison setting, not a calculated probability or a guarantee of safety. It does not apply to P/E range (18m), whose spacing comes from the historical range.
Set your own levels with My values
Where editing is available, enter a P/E in the fields beside the stock chart or drag a P/E line. This selects My values. You are changing your assumed price for the earnings, not the company’s reported results.
To restore the calculated range, select P/E range (18m) again in the Valuation basis dropdown. To restore the 10% bands for a growth or analyst-target method, select that method again.