


Quality for utility companies
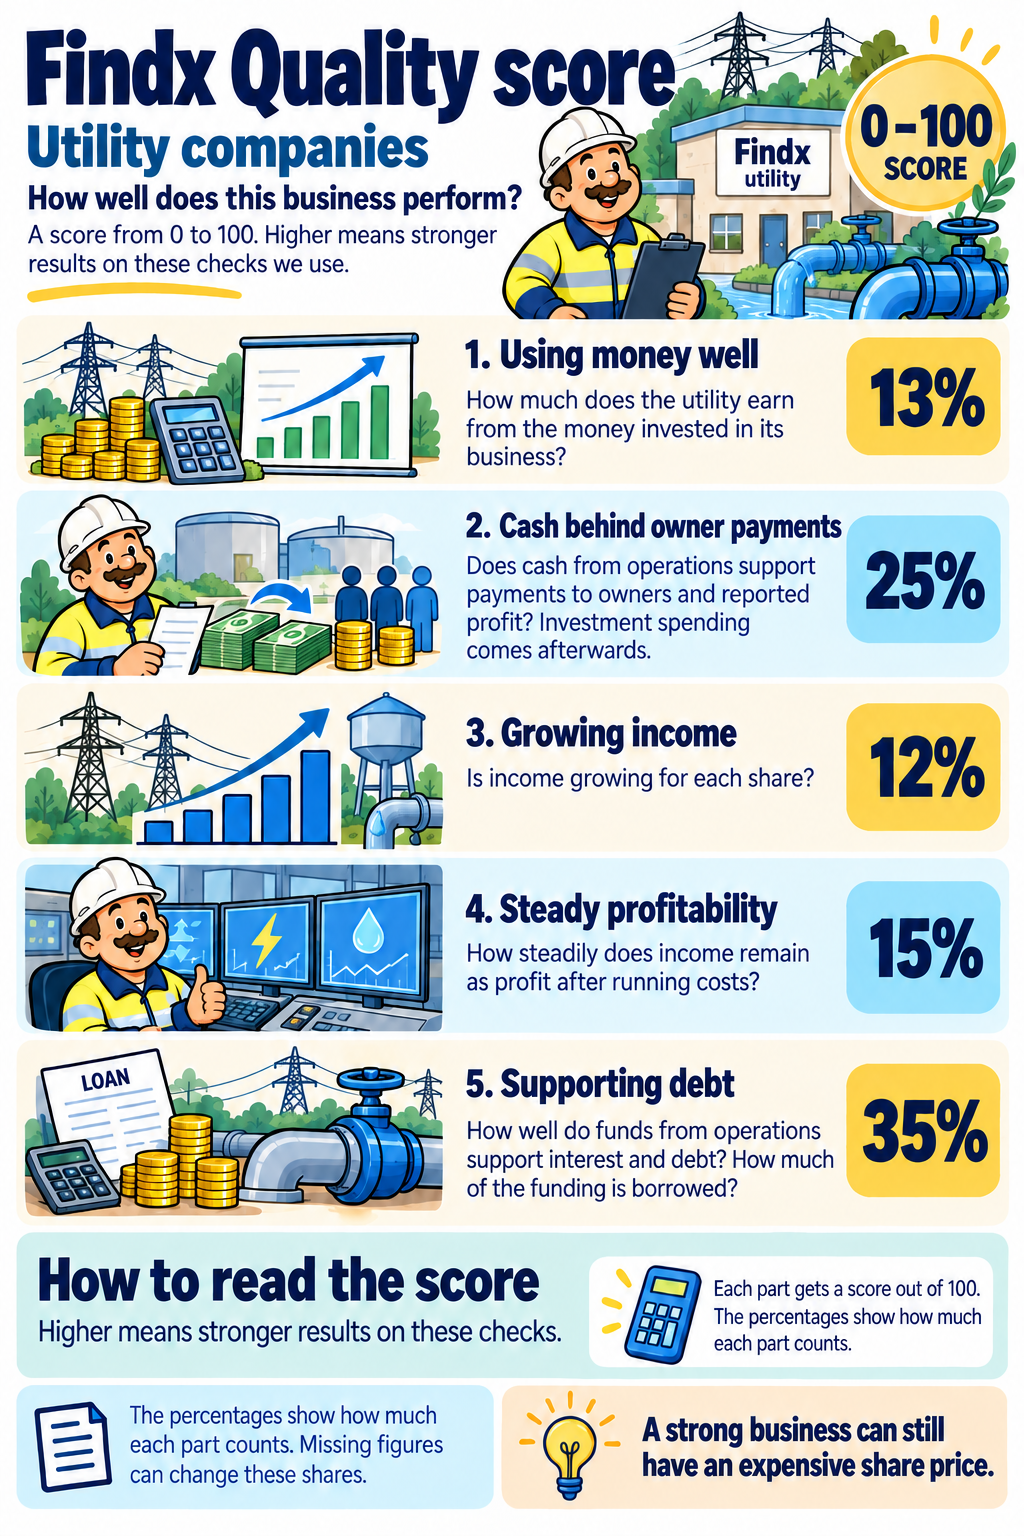
See how well this business uses money, earns profits and supports its finances. This guide covers businesses supplying services such as electricity and water. Their networks require large investments. How much does the utility earn from the money invested in its business? Does cash from operations support payments to owners and reported profit? Investment spending comes afterwards. Is income growing for each share? How steadily does income remain as profit after running costs? How well do funds from operations support interest and debt? How much of the funding is borrowed? Each part receives points from 0 to 100. The percentages above show how much each part counts. A higher total means stronger results on these checks. Missing figures reduce the information supporting the score and may change how much each remaining check counts. With too little usable information, no score is shown. Read the notes beside the company’s score. A usable return measure is required. A strong business can still have an expensive share price. The score does not predict what the share price will do. Utilities often invest large amounts in electricity networks, pipes and other infrastructure. We therefore give particular attention to debt and payment capacity. Large investments can leave free cash flow low even when operations perform well. A poor result and a missing figure are different things. A poor result lowers its part of the score. When a figure is missing, the other parts may receive more weight. We also show that the assessment is based on less information. We measure how much of the calculation has usable information. We use the component weights, so a missing measure with a large share matters more. At least 90% normally gives High confidence, 70% to below 90% gives Medium, and 60% to below 70% gives Limited. Confidence can be lower when some figures rely on an alternative calculation. We do not show an overall Quality score if usable information covers less than 60% of the calculation. We also need a usable return-on-capital measure. Without it, we do not show the score. For a bank, we use the corresponding bank return measure. A measure that is not used for that business type does not count as missing. For example, we do not assess a bank using the standard free cash flow calculation.The score in pictures
What we check
Using money well (13%)
Cash behind owner payments (25%)
Growing income (12%)
Steady profitability (15%)
Supporting debt (35%)
How to read the score
How we calculate the points
Utility companies
What happens when figures are missing?