


Quality for most companies
What makes a strong business?
A good business needs more than a good year. The Quality score looks at how well the company uses its money, earns profit and supports its finances.
This guide applies to most businesses, including shops, manufacturers and software companies.
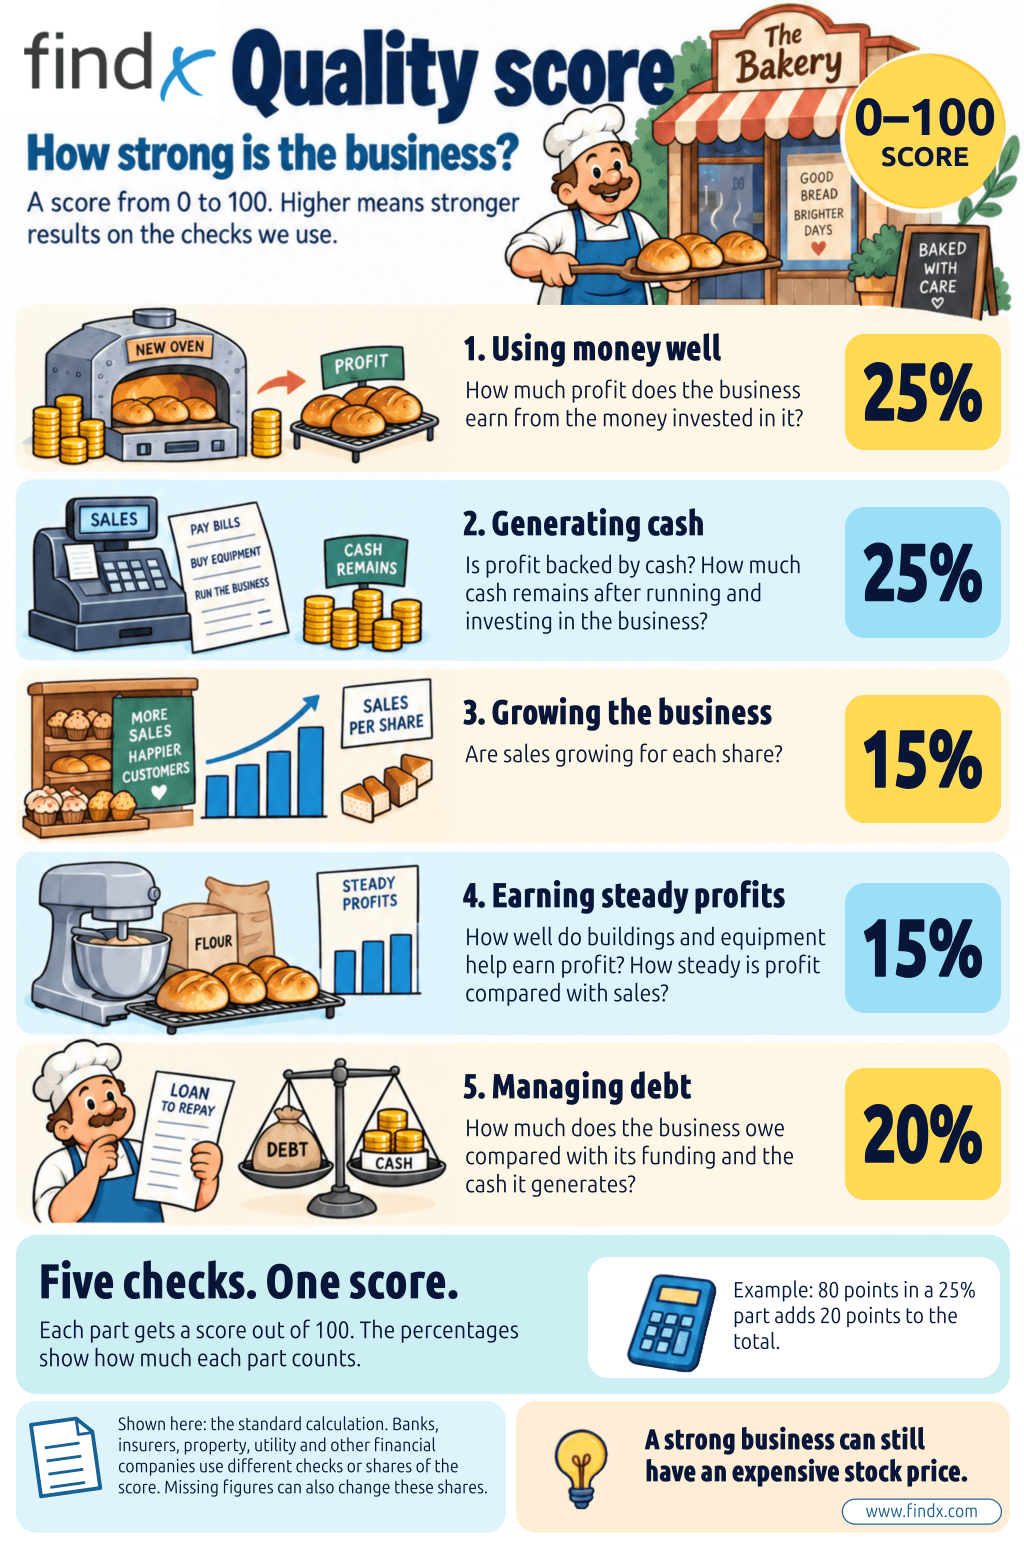
5 parts. One score from 0 to 100.
The score describes the business. It does not tell you whether the shares are cheap.
What does the number tell you?
A higher score means stronger results on these checks.
Each part receives points from 0 to 100. The percentages above show how much each part counts. A higher total means stronger results on these checks.
Questions behind the score
The percentages show how much each part counts. How much profit comes from the money invested in the business? This describes a return in the business, not the return you receive on your shares. Is profit backed by cash? What remains after running and investing in the business? This is the free cash flow margin: the share of sales left as cash after those costs. Are sales growing for each share? Using an amount per share allows for changes in the number of shares. How well do assets help earn profit? How steady is profit compared with sales? Steady positive profits are more reassuring than results that swing sharply. How large is debt compared with the money funding the business and the cash it generates? A smaller debt share leaves more room when results weaken.Using money well
See how the points are calculated
Generating cash
See how the points are calculated
Growing sales
See how the points are calculated
Earning steady profits
See how the points are calculated
Managing debt
See how the points are calculated
Missing figures reduce the information supporting the score and may change how much each remaining check counts. With too little usable information, no score is shown. Read the notes beside the company’s score. A usable return measure is required.
How we calculate the points
Explore the calculation, the periods used and the information behind the result. This calculation applies to most businesses, including manufacturers, retailers and software companies. Further down, we explain the differences for banks, property companies and other business types. We use up to five completed financial years. To find a typical result, we sort the returns and take the middle value, called the median. If the returns are 8%, 10%, 12%, 14% and 16%, the median is 12%. This reduces the influence of one unusually good or bad year. On the standard ROIC scale, 8% or less earns 0 points and 20% or more earns 100 points. Values in between receive proportionate points. The typical year's points count for 60%, and recent performance counts for 40%. When trailing-twelve-month figures are available, the recent part combines 80% from the latest completed financial year with 20% from the latest twelve months. The business can then earn up to 10 extra points for good returns across several years. Of this bonus, 70% depends on the individual years: a year earns no bonus credit at 8% or less and full credit at 12% or more. Between 8% and 12%, credit increases gradually. The remaining 30% depends on how far the median lies between 12% and 20%. The ROIC component can receive no more than 100 points in total. The tax recorded in the accounts affects ROIC. An unusual tax charge or tax benefit can therefore make one year look better or worse. Looking across several years reduces the influence of such a change. For free cash flow, history counts for 80% and the latest twelve months for 20% when both are available. History considers both how much cash remains (70%) and how consistently cash remains after investment spending (30%). A free cash flow margin of 0% earns no positive-cash credit for that year; 1% earns full credit for that check. This checks whether cash is left over; the amount is assessed separately too. When comparing operating cash with profit, completed financial years count for 75% and recent quarterly or half-year reports for 25%. We use the median ratio from each group. If the company makes a loss, the ratio cannot be interpreted in the usual way. We therefore also check whether operations produce or consume cash. For debt, we use the latest twelve-month figures when available, otherwise the latest completed financial year. No debt earns full points in the debt measures. If the company has debt but operations generate no cash, the debt-to-operating-cash comparison receives 0 points. A poor result and a missing figure are different things. A poor result lowers its part of the score. When a figure is missing, the other parts may receive more weight. We also show that the assessment is based on less information. We measure how much of the calculation has usable information. We use the component weights, so a missing measure with a large share matters more. At least 90% normally gives High confidence, 70% to below 90% gives Medium, and 60% to below 70% gives Limited. Confidence can be lower when some figures rely on an alternative calculation. We do not show an overall Quality score if usable information covers less than 60% of the calculation. We also need a usable return-on-capital measure. Without it, we do not show the score. For a bank, we use the corresponding bank return measure. A measure that is not used for that business type does not count as missing. For example, we do not assess a bank using the standard free cash flow calculation.How the checks add up
Standard companies
The finer details
How we calculate the return-on-capital points
How do we use older and newer figures?
What happens when figures are missing?
What happens when figures are missing?