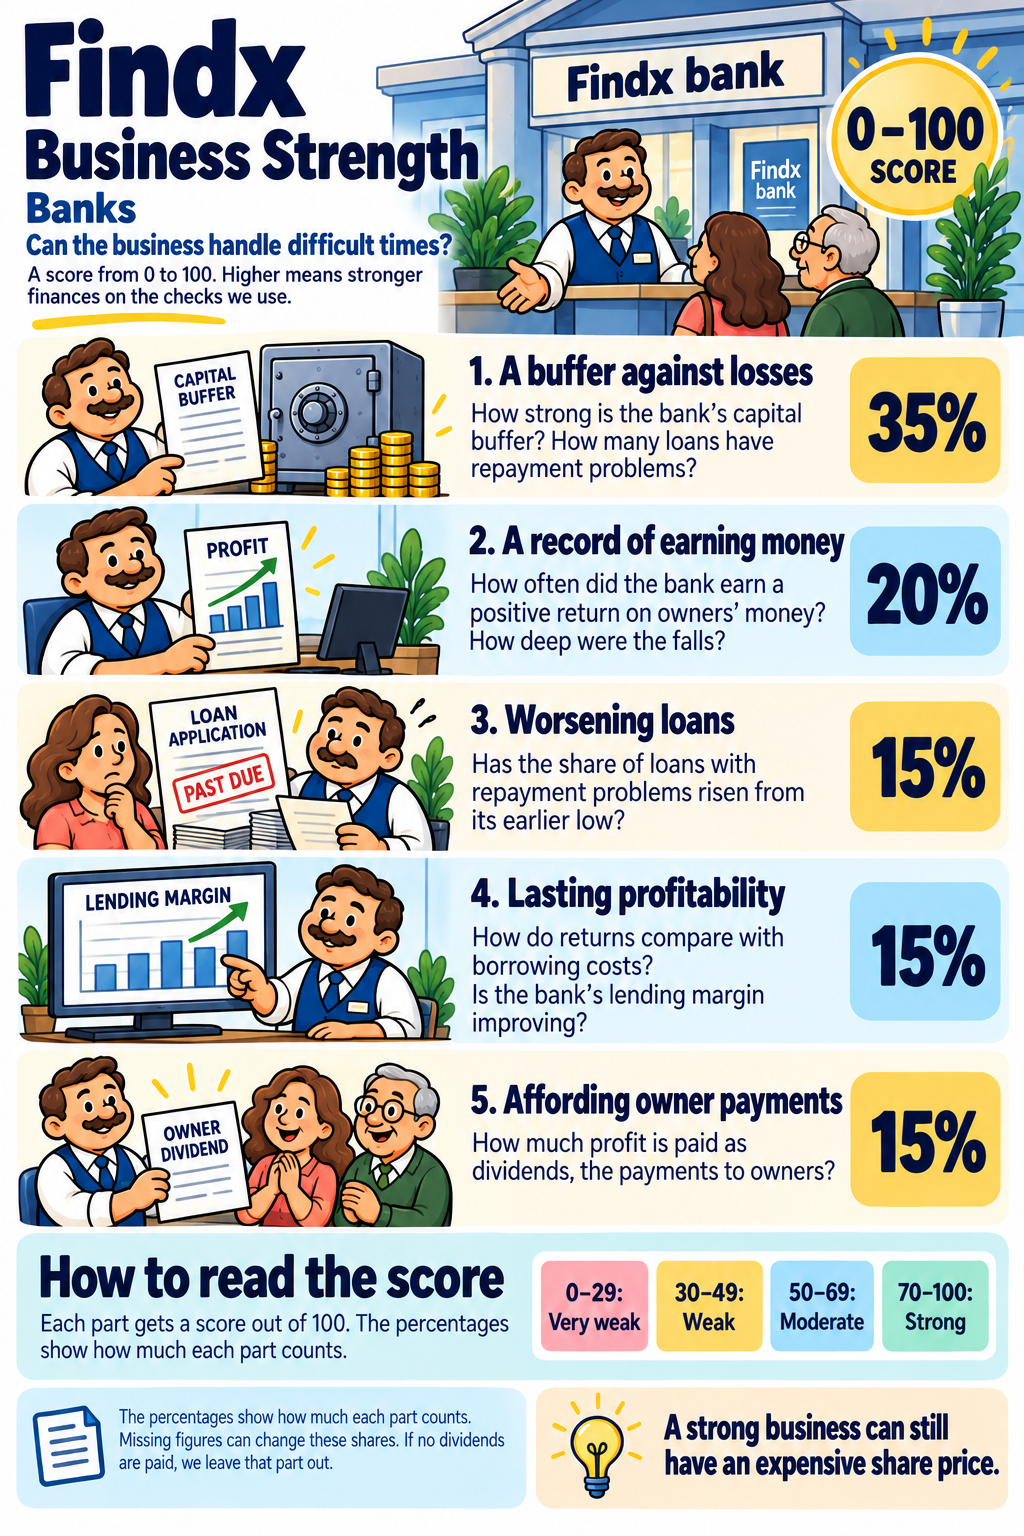
We use checks suited to lending. A bank’s money set aside to absorb losses is called its capital buffer.
A buffer against losses (35%)
How strong is the bank’s capital buffer? How many loans have repayment problems?
A record of earning money (20%)
How often did the bank earn a positive return on owners’ money? How deep were the falls?
Worsening loans (15%)
Has the share of loans with repayment problems risen from its earlier low?
Lasting profitability (15%)
How do returns compare with borrowing costs? Is the bank’s lending margin improving?
Affording owner payments (15%)
How much profit is paid as dividends, the payments to owners?
How to read the score
70–100 means strong, 50–69 moderate, 30–49 weak, and 0–29 very weak. A good total can still come with a warning about a specific weakness.
The percentages assume the company pays dividends. Dividends are payments to owners. If it pays none, we leave out that part and share the score between the other four parts in the same proportions.
Missing figures reduce the information supporting the score and may change how much each remaining check counts. With too little usable information, no score is shown. Read the notes beside the company’s score. Enough information about debt and payment capacity is also required.
A strong business can still have an expensive share price. The score does not predict what the share price will do.
How we calculate the points
Banks
For a bank, the central questions are how much capital can absorb losses and how many loans are going bad. Ordinary company debt ratios do not describe a bank's funding in the same way.
We give the largest single share of the debt part to problem loans, then check capital in three ways. Past profitability is measured using ROAE: profit compared with the shareholders' average capital. Changes in problem loans show how lending has weakened.
NIM compares net interest income with the assets that earn interest. If it is unavailable, we use net interest income divided by assets and label the substitution. We do not award points for larger loan-loss allowances: they can reflect larger expected losses.
Debt and ability to pay
▸The bank's core capital bufferCore capital is money that can absorb losses before creditors bear them. The Tier 1 ratio compares this capital with assets adjusted for their strength. More core capital relative to those risks gives the bank a larger buffer.Counts for 30% of this sub-score. Points: 8% gives 0 points; 14% gives 100.
▸The bank's total capital bufferThis includes core capital and other capital that qualifies to absorb losses under banking rules. We compare the total with assets adjusted for their strength. It adds a wider view of protection alongside the separate check of core capital.Counts for 15% of this sub-score. Points: 10.5% gives 0 points; 17% gives 100.
▸Capital compared with the bank's full exposureWe also compare core capital with the bank's overall exposure without adjusting each asset for its risk. This asks how large the buffer is relative to the scale of the business. It complements the other capital ratios, which depend on risk weights.Counts for 15% of this sub-score. Points: 3% gives 0 points; 5% gives 60; 7% gives 100.
▸Loans with repayment problemsWe measure the share of loans that borrowers are not repaying as agreed. If 2 of every 100 lent is in this category, the problem-loan share is 2%. A lower share means less of the loan book is already showing repayment problems.Counts for 40% of this sub-score. Points: 1% gives 100 points; 8% gives 0.
Profit and cash through difficult years
▸Years when the bank earned a positive returnROAE compares the bank's profit with the average capital belonging to its shareholders. We count the years when this return was positive. More positive years show that the bank has earned a return on its owners' capital more consistently.Counts for 60% of this sub-score.
▸Largest fall in the bank's returnWe find the largest relative decline in the bank's return on shareholders' capital. A return falling from 12% to 6% has halved, a decline of 50%. A smaller fall means this measure of profitability has held up better.Counts for 40% of this sub-score.
Sensitivity to downturns
▸Have more loans developed problems?We compare the latest annual problem-loan share with its lowest earlier level in the years examined. A rise from 1% to 3% is an increase of 2 percentage points. Smaller increases mean less deterioration in the loan book; the present level is assessed separately in the debt part.Counts for 100% of this sub-score. Points: We compare the latest annual share with its earlier low over up to eight years. No rise gives 100 points; a rise of 0.5 percentage points gives 80; 1 gives 60; 2 gives 30; 3 or more gives 0.
Lasting profitability
▸Return compared with borrowing costWe compare the return earned in the business with its estimated borrowing cost after tax. A return of 12% and a borrowing cost of 4% leave a gap of 8 percentage points. A larger gap is stronger here. We average the yearly gaps to avoid relying on just one year; this comparison does not include the return shareholders require. For this company type we use ROAE. ROAE measures profit on shareholders' capital; the borrowing rate relates to debt, so these percentages have different bases.Counts for 66.67% of this sub-score. Points: 0 percentage points gives 0 points; 8 percentage points gives 100.
▸Is the bank's interest margin improving?We look at the trend in net interest margin: net interest income compared with the assets earning interest. A rising margin means more net interest income for the same amount of those assets. If reported margin is unavailable, we use net interest income divided by assets and explain the substitution.Counts for 33.33% of this sub-score. Points: −2 percentage points per year gives 0 points; +2 percentage points per year gives 100.
Ability to support the dividend
▸How much of the profit is paid out?We compare dividends with profit from the same period. If profit is 10 per share and the dividend is 4, the company pays out 40% of its profit. A smaller payout share leaves more room to keep paying if earnings fall.Counts for 100% of this sub-score. Points: Up to 40% payout gives 100 points; 60% gives 80; 80% gives 40; 100% or more gives 0.
Which years do we look at?
To see how the business handled difficult years, we look back over up to eight full financial years. For lasting profitability, we use up to five. Most historical checks need at least three usable years. With only three or four, confidence is Limited.
For current debt and dividend checks, we use the latest 12 months, often called TTM. If those figures are missing, we use the latest full financial year. A ratio always compares figures from the same period.
We do not count a rolling 12-month total as an extra financial year. We also do not pull in older years to fill gaps. The cards show the periods used.
How much information supports the score?
Data coverage tells you how much of the planned calculation we can support with usable figures, taking each measure's share into account.
High: at least 90% coverage. Good: at least 70%. Limited: at least 60%. We also need at least 60% of the debt part to be measured. Without that debt information, or below 60% overall coverage, we show no score.
Short histories of three or four years, certain substitute measures, and the insurance and financial-services methods limit confidence to Limited. The label describes the information supporting the score, not a guarantee about the future.
The one idea that matters most in Findx
It is important that you understand how Findx arrives at Fair Value. Please take a minute to watch this short explainer.
It is very important that you understand this
Fair Value is an estimate, and you choose the basis it is built on. Do not invest based on our default without understanding how we calculate it.