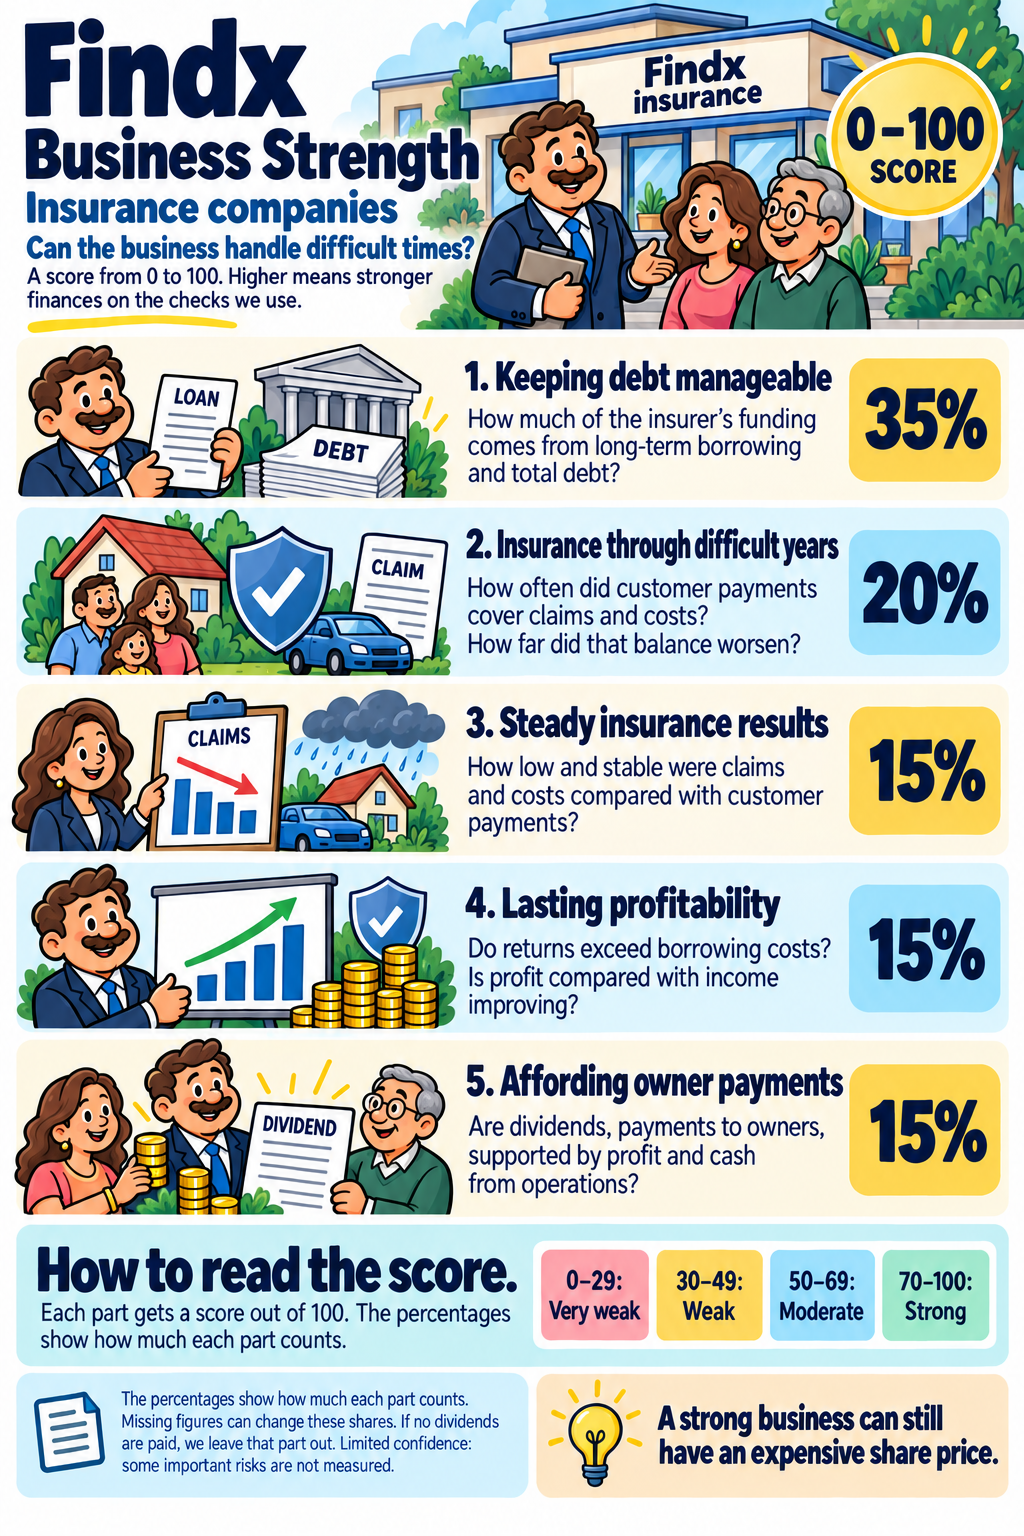
Customer payments for insurance are called premiums. Claims are the costs of covered damage or losses.
Keeping debt manageable (35%)
How much of the insurer’s funding comes from long-term borrowing and total debt?
Insurance through difficult years (20%)
How often did customer payments cover claims and costs? How far did that balance worsen?
Steady insurance results (15%)
How low and stable were claims and costs compared with customer payments?
Lasting profitability (15%)
Do returns exceed borrowing costs? Is profit compared with income improving?
Affording owner payments (15%)
Are dividends, payments to owners, supported by profit and cash from operations?
How to read the score
70–100 means strong, 50–69 moderate, 30–49 weak, and 0–29 very weak. A good total can still come with a warning about a specific weakness.
The percentages assume the company pays dividends. Dividends are payments to owners. If it pays none, we leave out that part and share the score between the other four parts in the same proportions.
Confidence is always Limited for this method because some important risks are not covered by the available data.
Missing figures reduce the information supporting the score and may change how much each remaining check counts. With too little usable information, no score is shown. Read the notes beside the company’s score. Enough information about debt and payment capacity is also required.
A strong business can still have an expensive share price. The score does not predict what the share price will do.
How we calculate the points
Insurance companies
An insurer collects premiums and pays claims and operating costs. The combined ratio compares those claims and costs with premiums. At 95%, it uses 95 of every 100 in premiums. Below 100% means an underwriting profit, before investment income.
We assess how often premiums covered these costs, how badly that relationship deteriorated, and how stable it has been. The level receives slightly more emphasis than fluctuations because consistently losing money on policies matters even when results are steady.
These checks need at least five full years with usable combined-ratio figures. Confidence is Limited because the model does not include a complete insurance solvency assessment.
Debt and ability to pay
▸Long-term borrowingWe compare long-term debt with the capital financing the business. If 40 of every 100 comes from long-term borrowing, the ratio is 40%. A smaller debt share gives the company more room when results weaken.Counts for 60% of this sub-score. Points: 0% gives 100 points; 70% gives 0.
▸Total debt in the financingWe compare all debt, both short-term and long-term, with total capital. This adds borrowing that the long-term-debt measure does not cover. A smaller debt share means less of the business is financed with money that must be repaid.Counts for 40% of this sub-score.
Profit and cash through difficult years
▸Years when insurance premiums covered the costsWe count the years when premiums were larger than claims and insurance operating costs. In those years, the combined ratio was below 100%. More such years show that the insurance business has more often earned money before investment income is added.Counts for 50% of this sub-score.
▸Largest increase in insurance costs relative to premiumsWe find the largest rise in claims and operating costs as a share of premiums. Moving from 95% to 105% means costs have increased by 10 percentage points relative to premiums, turning an underwriting profit into a loss. Smaller rises mean the insurance business has suffered less deterioration.Counts for 50% of this sub-score. Points: 2 percentage points gives 100 points; 20 percentage points gives 0.
Sensitivity to downturns
▸How much of the premiums goes on claims and costs?We average the annual combined ratios. At 95%, claims and operating costs use 95 of every 100 in premiums, leaving 5 before investment income. A lower average shows a larger margin in the insurance operation itself.Counts for 60% of this sub-score. Points: 90% gives 100 points; 110% gives 0.
▸How much do insurance results fluctuate?We examine how much the annual combined ratios vary around their average. Results close to 95% every year are steadier than results moving between 80% and 110%. Smaller fluctuations make insurance profitability more predictable; its average level is assessed separately.Counts for 40% of this sub-score. Points: 0.05 gives 100 points; 0.20 gives 0. Variation is the standard deviation divided by the average: a way to compare fluctuations with the usual level.
Lasting profitability
▸Return compared with borrowing costWe compare the return earned in the business with its estimated borrowing cost after tax. A return of 12% and a borrowing cost of 4% leave a gap of 8 percentage points. A larger gap is stronger here. We average the yearly gaps to avoid relying on just one year; this comparison does not include the return shareholders require. For this company type we use insurance return on capital.Counts for 66.67% of this sub-score. Points: 0 percentage points gives 0 points; 8 percentage points gives 100.
▸Is profitability improving or weakening?We examine how the company's profit margin has changed over several years. A margin shows how much of its income becomes profit. A rise from 10% to 12% means 2 more of every 100 in income is left as profit. A rising margin strengthens this part of the score; a falling one weakens it.Counts for 33.33% of this sub-score. Points: −2 percentage points per year gives 0 points; +2 percentage points per year gives 100.
Ability to support the dividend
▸How much of the profit is paid out?We compare dividends with profit from the same period. If profit is 10 per share and the dividend is 4, the company pays out 40% of its profit. A smaller payout share leaves more room to keep paying if earnings fall.Counts for 66.67% of this sub-score. Points: Up to 40% payout gives 100 points; 60% gives 80; 80% gives 40; 100% or more gives 0.
▸Cash available to cover dividendsWe compare cash from operations with the dividend payment. If operations generate 200 million and dividends cost 100 million, cash covers the dividend twice. Higher coverage leaves more room, but investment in assets must also be financed from this cash or other sources.Counts for 33.33% of this sub-score. Points: 1× gives 0 points; 2× gives 100.
Which years do we look at?
To see how the business handled difficult years, we look back over up to eight full financial years. For lasting profitability, we use up to five. Most historical checks need at least three usable years. With only three or four, confidence is Limited.
For current debt and dividend checks, we use the latest 12 months, often called TTM. If those figures are missing, we use the latest full financial year. A ratio always compares figures from the same period.
We do not count a rolling 12-month total as an extra financial year. We also do not pull in older years to fill gaps. The cards show the periods used.
How much information supports the score?
Data coverage tells you how much of the planned calculation we can support with usable figures, taking each measure's share into account.
High: at least 90% coverage. Good: at least 70%. Limited: at least 60%. We also need at least 60% of the debt part to be measured. Without that debt information, or below 60% overall coverage, we show no score.
Short histories of three or four years, certain substitute measures, and the insurance and financial-services methods limit confidence to Limited. The label describes the information supporting the score, not a guarantee about the future.
The one idea that matters most in Findx
It is important that you understand how Findx arrives at Fair Value. Please take a minute to watch this short explainer.
It is very important that you understand this
Fair Value is an estimate, and you choose the basis it is built on. Do not invest based on our default without understanding how we calculate it.