


Strength for property companies
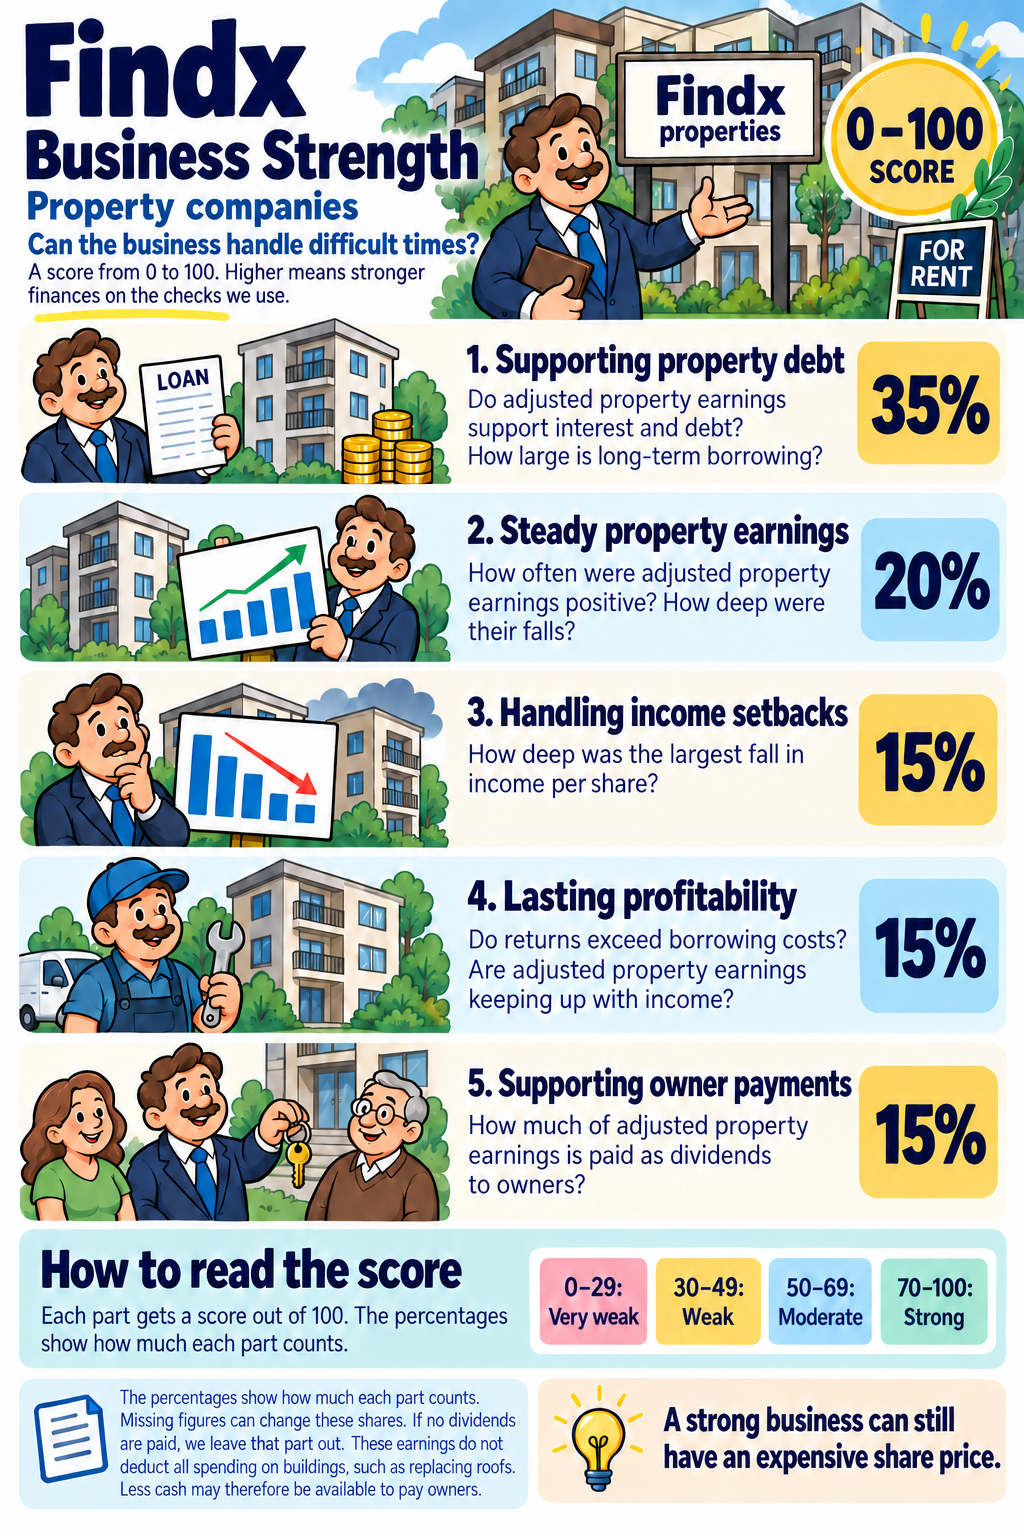
See how well the business is equipped to handle difficult times. This guide uses adjusted property earnings, called FFO. The calculation adds back the gradual reduction in properties’ recorded value and adjusts certain other items. These earnings do not deduct all spending on buildings, such as replacing roofs. Less cash may therefore be available to pay owners. If these figures are unavailable, Findx uses the guide for most companies. Do adjusted property earnings support interest and debt? How large is long-term borrowing? How often were adjusted property earnings positive? How deep were their falls? How deep was the largest fall in income per share? Do returns exceed borrowing costs? Are adjusted property earnings keeping up with income? How much of adjusted property earnings is paid as dividends to owners? 70–100 means strong, 50–69 moderate, 30–49 weak, and 0–29 very weak. A good total can still come with a warning about a specific weakness. The percentages assume the company pays dividends. Dividends are payments to owners. If it pays none, we leave out that part and share the score between the other four parts in the same proportions. Missing figures reduce the information supporting the score and may change how much each remaining check counts. With too little usable information, no score is shown. Read the notes beside the company’s score. Enough information about debt and payment capacity is also required. A strong business can still have an expensive share price. The score does not predict what the share price will do. Property depreciation can make ordinary accounting profit less useful for assessing property operations. We use FFO, an earnings measure adjusted for property depreciation and certain other items. FFO is not cash left after maintaining and improving properties. We do not use AFFO here. FFO helps us assess interest coverage, debt and dividends. Its positive years and largest decline show resilience. We use sales per share for downturn sensitivity, so the same FFO decline is not counted again in that part. Property companies without usable FFO data follow the ordinary-company method. To see how the business handled difficult years, we look back over up to eight full financial years. For lasting profitability, we use up to five. Most historical checks need at least three usable years. With only three or four, confidence is Limited. For current debt and dividend checks, we use the latest 12 months, often called TTM. If those figures are missing, we use the latest full financial year. A ratio always compares figures from the same period. We do not count a rolling 12-month total as an extra financial year. We also do not pull in older years to fill gaps. The cards show the periods used. Data coverage tells you how much of the planned calculation we can support with usable figures, taking each measure's share into account. High: at least 90% coverage. Good: at least 70%. Limited: at least 60%. We also need at least 60% of the debt part to be measured. Without that debt information, or below 60% overall coverage, we show no score. Short histories of three or four years, certain substitute measures, and the insurance and financial-services methods limit confidence to Limited. The label describes the information supporting the score, not a guarantee about the future.The score in pictures
What we check
Supporting property debt (35%)
Steady property earnings (20%)
Handling income setbacks (15%)
Lasting profitability (15%)
Supporting owner payments (15%)
How to read the score
How we calculate the points
Property companies (REITs)
Debt and ability to pay
Profit and cash through difficult years
Sensitivity to downturns
Lasting profitability
Ability to support the dividend
Which years do we look at?
How much information supports the score?