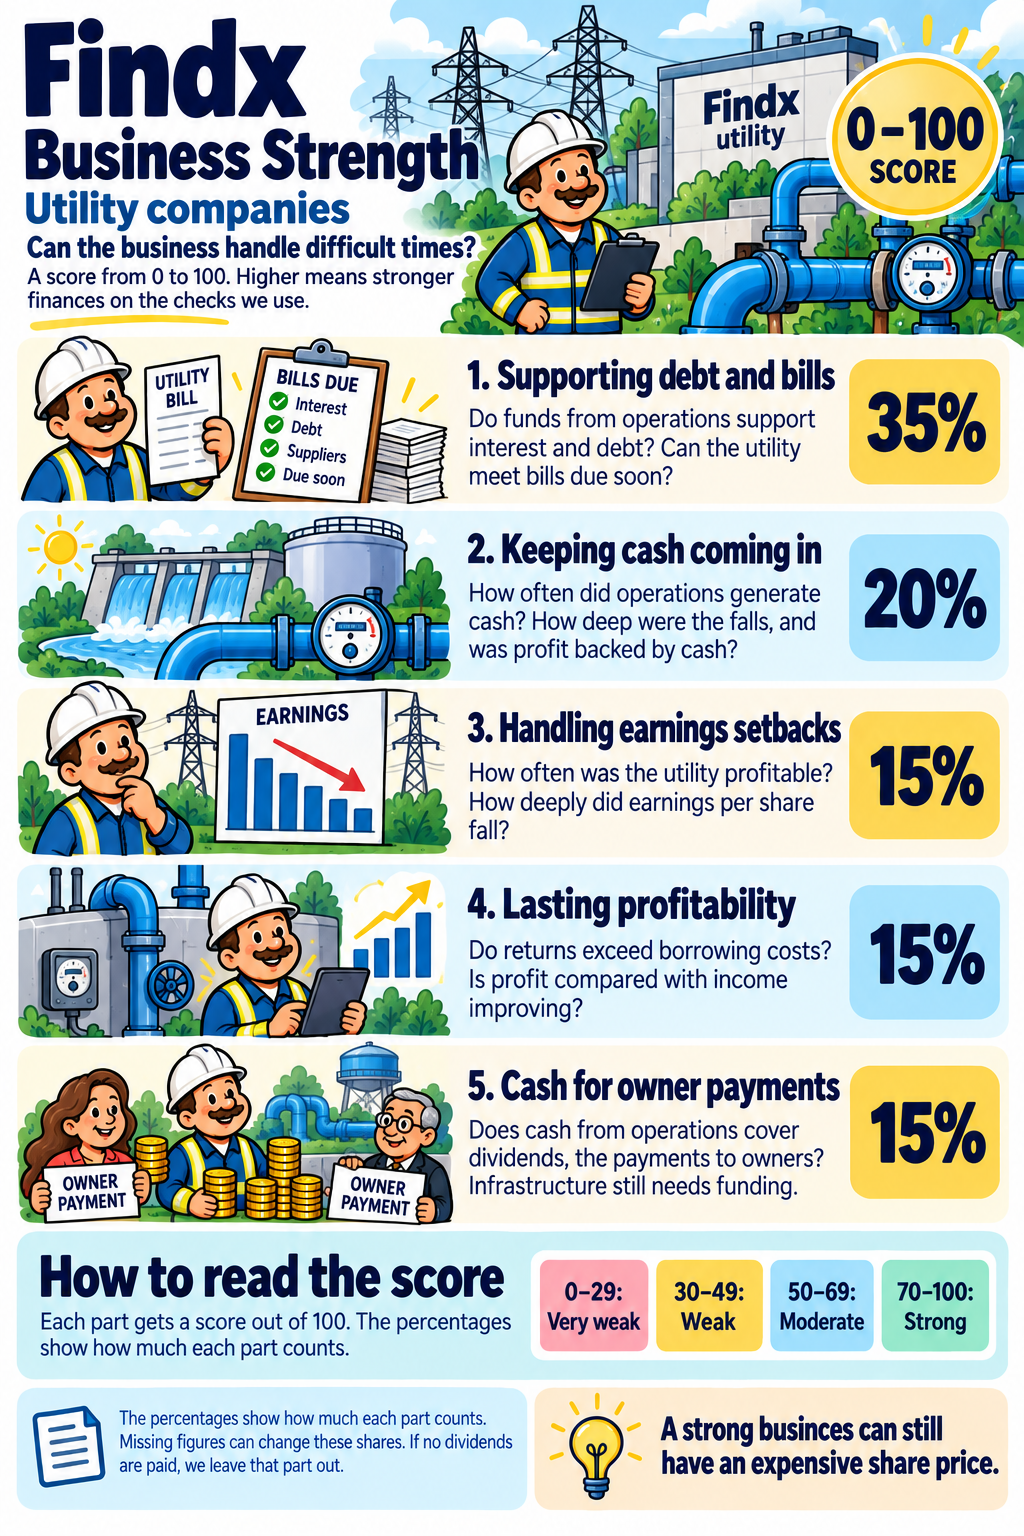
This guide covers businesses supplying services such as electricity and water. Their networks require large investments.
Supporting debt and bills (35%)
Do funds from operations support interest and debt? Can the utility meet bills due soon?
Keeping cash coming in (20%)
How often did operations generate cash? How deep were the falls, and was profit backed by cash?
Handling earnings setbacks (15%)
How often was the utility profitable? How deeply did earnings per share fall?
Lasting profitability (15%)
Do returns exceed borrowing costs? Is profit compared with income improving?
Cash for owner payments (15%)
Does cash from operations cover dividends, the payments to owners? Infrastructure still needs funding.
How to read the score
70–100 means strong, 50–69 moderate, 30–49 weak, and 0–29 very weak. A good total can still come with a warning about a specific weakness.
The percentages assume the company pays dividends. Dividends are payments to owners. If it pays none, we leave out that part and share the score between the other four parts in the same proportions.
Missing figures reduce the information supporting the score and may change how much each remaining check counts. With too little usable information, no score is shown. Read the notes beside the company’s score. Enough information about debt and payment capacity is also required.
A strong business can still have an expensive share price. The score does not predict what the share price will do.
How we calculate the points
Utility companies
Power networks and similar businesses require large, long-lived investments. We therefore put particular emphasis on the funds available to carry their debt.
Here, FFO means funds from operations as used in credit analysis. It is a measure of funds generated by the business. It differs from the adjusted property earnings also called FFO for REITs.
Interest coverage gets the largest share of the debt part. Debt size, the financing mix and short-term payment capacity complete it. Dividend support is measured using cash from operations, before spending on infrastructure.
Debt and ability to pay
▸Funds to support the utility's interest paymentsWe use the utility's FFO interest-coverage ratio to assess the funds supporting its interest costs. A larger ratio means a larger buffer if operations weaken. Here FFO is a credit-analysis measure of funds generated by operations, different from property-company FFO.Counts for 35% of this sub-score. Points: 1.5× gives 0 points; 5× gives 100.
▸The utility's funds from operations compared with debtWe compare one year's funds from operations, called FFO here, with total debt. At 20%, annual FFO equals one fifth of the debt. A higher percentage means the company generates more funds relative to the debt it carries.Counts for 25% of this sub-score. Points: 5% gives 0 points; 20% gives 100.
▸Long-term borrowingWe compare long-term debt with the capital financing the business. If 40 of every 100 comes from long-term borrowing, the ratio is 40%. A smaller debt share gives the company more room when results weaken.Counts for 25% of this sub-score. Points: 20% gives 100 points; 80% gives 0.
▸Resources for bills due soonWe compare short-term assets, such as cash, customer payments due and inventory, with debts due within a year. A ratio of 2 means 2 of assets for every 1 owed. More cover gives room to meet bills, although inventory and unpaid customer invoices are not cash yet.Counts for 15% of this sub-score. Points: 0.5× gives 0 points; 1.5× gives 100.
Profit and cash through difficult years
▸Years when operations generated cashWe count how many of the financial years examined had more cash coming in from day-to-day operations than going out. If this happened in six of eight years, the share is 75%. More years with positive operating cash flow show that the business generates cash more reliably.Counts for 24% of this sub-score.
▸Years with cash left after investmentWe count the years when cash from operations exceeded spending on assets such as buildings and equipment. In those years, the business had free cash flow left for other purposes. More such years show that it has regularly covered both operations and investment from its own cash generation.Counts for 16% of this sub-score.
▸Largest fall in cash from operationsWe find the largest fall from an earlier high to a later low in annual operating cash flow. A fall from 100 million to 60 million is 40%. Smaller declines mean the business has kept more of its cash generation during weak periods.Counts for 24.5% of this sub-score.
▸Largest fall in cash left after investmentWe find the largest decline in annual cash remaining after investment in assets. A smaller fall means this financial room has held up better. We give this less weight than operating cash flow because a major investment can temporarily reduce the money left, even when the business is healthy.Counts for 10.5% of this sub-score.
▸Cash behind the profit in the weakest yearAccounting profit does not always arrive as cash in the same year. We find the weakest usable year for cash from operations compared with profit. If profit was 100 million but operations generated only 50 million in cash, the ratio was 0.5. A higher weakest-year ratio means cash supported profit better even in that year.Counts for 25% of this sub-score. Points: 0.2× gives 0 points; 0.8× gives 100.
Sensitivity to downturns
▸Years with a profitWe count how often the company reported a positive profit per share during the years examined. A company that was profitable in all eight years has a stronger record here than one profitable in only four. This checks how often the business avoided losses, not how large its profits were.Counts for 50% of this sub-score. Points: 40% gives 0 points; 100% gives 100.
▸Largest fall in profit per shareWe measure the largest decline from an earlier high to a later low in profit per share. A fall from 10 to 4 per share is 60%. Smaller falls mean earnings have held up better when the business weakened.Counts for 50% of this sub-score. Points: 10% gives 100 points; 80% gives 0.
Lasting profitability
▸Return compared with borrowing costWe compare the return earned in the business with its estimated borrowing cost after tax. A return of 12% and a borrowing cost of 4% leave a gap of 8 percentage points. A larger gap is stronger here. We average the yearly gaps to avoid relying on just one year; this comparison does not include the return shareholders require. For this company type we use utility return on capital.Counts for 66.67% of this sub-score. Points: 0 percentage points gives 0 points; 8 percentage points gives 100.
▸Is profitability improving or weakening?We examine how the company's profit margin has changed over several years. A margin shows how much of its income becomes profit. A rise from 10% to 12% means 2 more of every 100 in income is left as profit. A rising margin strengthens this part of the score; a falling one weakens it.Counts for 33.33% of this sub-score. Points: −2 percentage points per year gives 0 points; +2 percentage points per year gives 100.
Ability to support the dividend
▸Cash available to cover dividendsWe compare cash from operations with the dividend payment. If operations generate 200 million and dividends cost 100 million, cash covers the dividend twice. Higher coverage leaves more room, but investment in assets must also be financed from this cash or other sources.Counts for 100% of this sub-score. Points: 1× gives 0 points; 2× gives 100.
Which years do we look at?
To see how the business handled difficult years, we look back over up to eight full financial years. For lasting profitability, we use up to five. Most historical checks need at least three usable years. With only three or four, confidence is Limited.
For current debt and dividend checks, we use the latest 12 months, often called TTM. If those figures are missing, we use the latest full financial year. A ratio always compares figures from the same period.
We do not count a rolling 12-month total as an extra financial year. We also do not pull in older years to fill gaps. The cards show the periods used.
How much information supports the score?
Data coverage tells you how much of the planned calculation we can support with usable figures, taking each measure's share into account.
High: at least 90% coverage. Good: at least 70%. Limited: at least 60%. We also need at least 60% of the debt part to be measured. Without that debt information, or below 60% overall coverage, we show no score.
Short histories of three or four years, certain substitute measures, and the insurance and financial-services methods limit confidence to Limited. The label describes the information supporting the score, not a guarantee about the future.
The one idea that matters most in Findx
It is important that you understand how Findx arrives at Fair Value. Please take a minute to watch this short explainer.
It is very important that you understand this
Fair Value is an estimate, and you choose the basis it is built on. Do not invest based on our default without understanding how we calculate it.