


Choose your valuation basis
A valuation basis is the rule used to choose a P/E for the fair value estimate. On a stock page, open the “Valuation basis” dropdown to choose between these six methods.
Where to make your choice
Open a stock page and find the Valuation basis menu beside the main chart. On a narrow screen, scroll below the chart. Click or tap the menu to see the six choices, then select the one you want to use.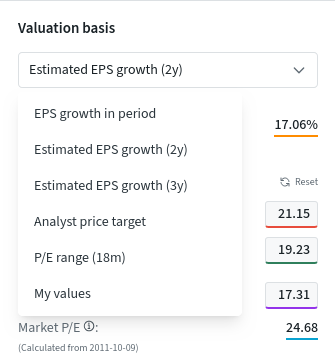
Your choice changes how Findx calculates the green fair value line. The six methods are explained below.
EPS means earnings per share: the company’s yearly profit divided by its number of shares. P/E means share price divided by earnings per share. Choosing a P/E of 15 means valuing each unit of annual earnings at 15.
All six methods end with the same step: chosen P/E × the earnings per share for the chart date = estimated price per share. What changes is how the P/E is chosen. “Estimated” means expected rather than already reported. Analysts are people who study companies and make those forecasts.
Three methods based on earnings growth
These methods calculate an equivalent yearly growth rate between a starting and ending earnings figure. That smooth rate is often called CAGR. For example, 2 growing to 2.42 over two years is equivalent to 10% growth each year: 2 → 2.20 → 2.42. Actual growth need not be the same each year.
Findx then turns that growth rate into a P/E using four groups: shrinking earnings, slow growth, moderate growth and fast growth. At 10% growth the rule gives P/E 14.5.
EPS growth in period
Uses earnings at the start and end of the selected chart period. The end can include an analyst estimate, so check the displayed years and estimate labels.
Changing the period changes the growth being measured. A recovery from an unusually weak starting year can make the rate look high.
Estimated EPS growth (2y)
Compares the latest completed financial year with expected earnings two financial years later. A financial year is the year covered by a company’s accounts.
If the starting year is 2025, the ending year is 2027. Earnings of 2 rising to 2.42 give 10% annual growth. This does not mean exactly two years from today.
Estimated EPS growth (3y)
Uses the latest completed financial year and expected earnings three financial years later.
With 2025 as the starting year, this ends in 2028. It includes an extra forecast year compared with the two-year choice, so the growth rate can differ.
See the four growth groups and their exact calculation.
Three methods that choose P/E differently
Analyst price target
A price target is an analyst’s estimate of a future share price. Findx converts the combined analyst target into a P/E by dividing it by the future annual earnings figure used for this method.
For example, a target of 36 and expected earnings of 2.40 give P/E 15. Applied to chart earnings of 2 today, that gives 30. Today’s fair value line therefore need not equal the analyst target.
P/E range (18m)
Finds the highest and lowest usable P/E among chart points in the last 18 months. Their midpoint sets Fair Value P/E; the high and low set the upper and lower bands.
For example, low P/E 10 and high P/E 20 give a middle of 15. This compares recent market pricing; it does not use the growth formula.
My values
Uses the P/E levels you enter or set by dragging the P/E lines. You can also edit future earnings where the controls allow it.
For example, choosing P/E 12 instead of 15 values earnings of 2 at 24 instead of 30. Changing an earnings assumption changes the result too. These edits change your calculation, not the company’s reported profit.
Which analyst target and earnings year are used?
Findx prefers the median target: the middle value when analysts’ targets are put in order. If that is unavailable, it uses their average. The earnings figure comes from the furthest future financial year ending within two years of the latest share-price date. If none fits that window, the nearest available future financial year is used.
If a choice is unavailable
Available choices depend on your access and the company’s data. The two- and three-year growth methods need positive earnings at both ends and an estimate for the required ending year. Check the reason shown beside an unavailable choice or warning.
Property companies may use FFO or AFFO, earnings measures adjusted for property accounting, in place of EPS. The earnings guide explains these measures .